Analytics, Integration, and KPIs for the Logistics Industry
Insight to help you optimize getting products from here to there
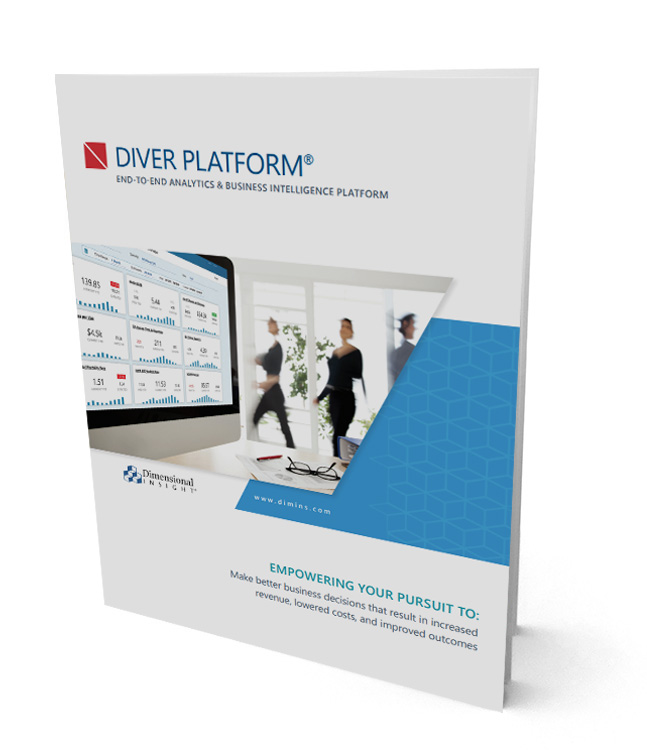
Integrate your data from multiple sources to gain a single, unified view of it and easily measure and manage the KPIs that run your business with Dimensional Insight’s Diver Platform
How can you succeed in this market? Your data holds the key. You need insight into where your products are at any point in time. You also need to understand operational performance in order to figure out not only where there are performance issues, but also where there are greater opportunities for success.
Dimensional Insight’s Diver Platform integrates disparate data from across your enterprise, standardizes it, creates metrics and KPIs, and visualizes it.
This allows you to:
- Quickly access the metrics most critical to your business operations
- Understand the business rules and definitions of KPIs
- Understand where products are in the supply chain
- Manage the performance of suppliers and subcontractors
- Uncover improvement opportunities
- Forecast future performance
- Comply with legislation and report to governing bodies
Meeting the needs of the logistics industry
Single, unified view
Integrate data from multiple sources into one view for users. Data governance ensures the use of consistent, standardized, validated, and documented business rules and measures across applications. This means all departments are using the same definitions for decision-making.
Flexible KPI management
Centralized location for KPI definitions ensures consistency across the enterprise and truth in the numbers. Role-based access allows users to see the KPIs critical to their jobs.
Rich visualizations
Self-service functionality allows users to create their own dashboards using the visualizations important to their role in the format that is most intuitive to their needs. Visualizations include real-time maps that update as soon as your data set refreshes.
Advanced analytics
Data scientists and power users can utilize “point and click” ad hoc analytics to explore large data sets with unlimited dimensions. Users can uncover insights previously unattainable leading to better decisions. Advanced analytical functionality utilizing predictive analytics and forecasting is available for further exploration and discovery.
Scalable
Deployments are customized to users’ needs, and can be easily scaled up or down depending on requirements.
Use on any device
Dashboards are accessible from desktops, laptops, tablets, and mobile phones so users can access data and make decisions wherever they are on a device best suited for their needs
Take a deeper dive into the technology behind Diver Platform
Here’s what our customers say
Featured Resources
FREJA
Read case study →